
American importers paid roughly $287bn in tariff revenue and associated fees in 2025, a 192% increase on the year before. US effective tariff rates climbed to about 17%, the highest sustained level since the 1930s.
Those numbers land in one line of one formula. Most companies have not updated it.
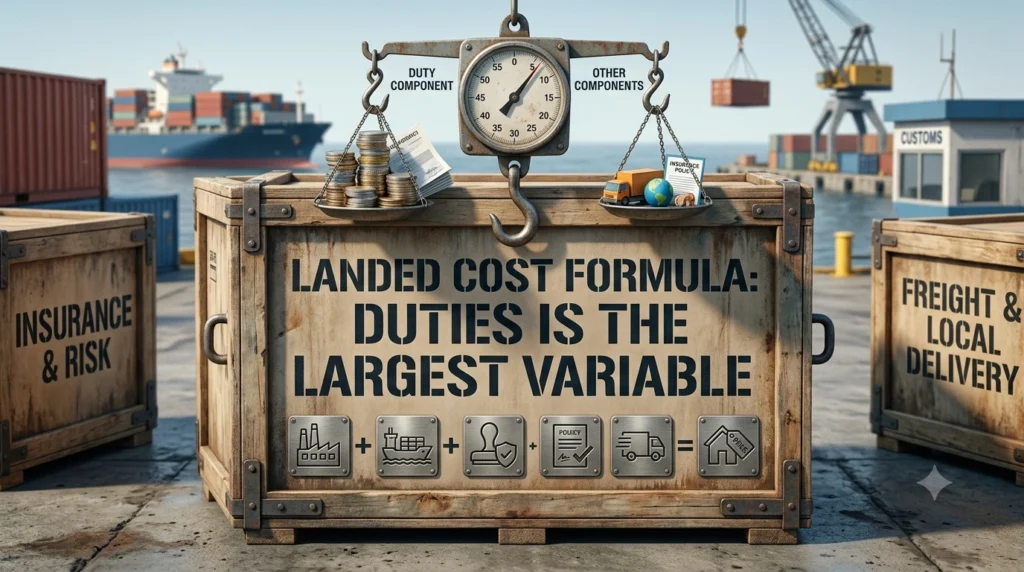
Landed cost is the total cost of moving goods from a supplier’s dock to your warehouse, and it is the only number that makes two sourcing options genuinely comparable. Unit price does not. Freight-inclusive price does not. The full stack runs: product cost, international freight, cargo insurance, import duties, the merchandise processing fee, the harbour maintenance fee, customs brokerage, drayage to the warehouse, and any inspection or compliance cost attached to the entry.
What the formula was built to assume
For thirty years the duty component behaved like a constant. You classified a product once, confirmed the HS code, looked up the rate, and that rate held for years. Analysts built landed-cost models in spreadsheets, refreshed them annually, and spent their attention on the volatile parts: ocean rates, fuel, currency.
That assumption is what broke. A duty rate modelled at 5% in 2024 sits at 35% or higher for some categories today, and stacking across overlapping authorities has pushed the total burden above 70% on certain goods. The volatile line is no longer freight. It is the line nobody used to model.
The rules around the edges moved too. From 1 July 2026 the European Union began phasing out its €150 duty de minimis exemption for e-commerce imports and introduced a €3 customs charge per declaration line, with a further handling fee expected later in the year. Small parcels that carried no duty now carry both duty and a processing cost.
Scenario weighting replaces the single number
The practice replacing static landed cost is straightforward to describe and hard to run: model three to five discrete trade-policy scenarios over a 12 to 24 month horizon, weight each by probability, calculate the supplier’s landed cost under each, and allocate volume against the weighted average.
A baseline where current rates hold. A negotiated reduction. An escalation path. A retaliation case where a supplier’s own government responds. The output is not a winner but a distribution — which is the honest answer when the input is a policy decision nobody controls.
Gartner’s Suzie Petrusic has framed the underlying shift for supply chain leaders, arguing that enterprises should treat tariff volatility as a “multiyear, dynamic event” rather than a passing shock. A model refreshed annually cannot represent a multiyear dynamic event. It represents a photograph of one.
Almost nobody has the plumbing
Running this requires three things most organisations lack: HS-code-level classification for every SKU, country-of-origin data that extends into sub-tier supply, and freight, insurance and compliance costs integrated into the same model.
The adoption numbers are stark. A 2026 survey of trade professionals found global trade management platforms in use at 32% of organisations, tariff management tools at 7%, and classification management systems at 4%. Meanwhile 92% of supply chain leaders surveyed by Gartner named increased costs as their top tariff-related risk, and 40% said they were responding by re-examining country-of-origin rules, valuation and trade practices.
So the problem is universally recognised and almost universally untooled. That gap is the opportunity.
Pick the lowest unit cost and you are making a bet on a tariff schedule holding still. It has not held still for two years. The sourcing question is no longer which supplier is cheapest today, but which allocation survives the most scenarios.
Sources
- Stout, “Tariff-Adjusted Landed Cost as the New Sourcing Metric”, 28 May 2026 — 17% effective tariff rate, $287bn collected, scenario-weighting method, data prerequisites
- SupplyChainBrain, “Tariff-Adjusted Landed Cost as the New Sourcing Metric”, 13 May 2026 — scenario construction examples
- Passport, “Landed Cost Calculator: How to Calculate Total Import Costs”, 4 June 2026 — duty stacking above 70%, EU de minimis phase-out and €3 charge
- Thomson Reuters, “The 2026 supply chain challenge: Global trade disruption”, 12 February 2026 — technology adoption rates
- Gartner, “Gartner Survey Shows Supply Chain Leaders Plan to Pass Costs to Customers”, 30 April 2025 — 92% increased costs, 40% country-of-origin response
- Logistics Management, “Gartner examines how supply chain leaders can win amid tariff shifts” — Petrusic quote